VitalMetrics Reporting Features
A performance intelligence system that connects your marketing spend to real revenue results. With 17 AI agents, get real-time insights into your marketing performance & make smarter decisions.

Get to the data that matters and make smarter decisions.
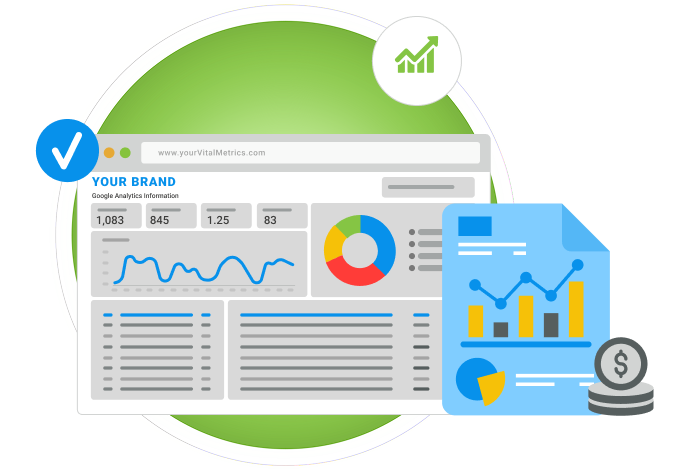
VitalMetrics Reporting Dashboard is a first in class reporting and revenue management dashboard that attempts to tie more closely the impacts of your marketing investment on your business goals and outcomes. It has tiers to support basic reporting, advanced reporting with AI agent insights, and a leads dashboard that acts as a simple CRM integrating with major third-party CRMs, as well as manually allowing customers to enter won deals and tie revenue to marketing leads. For the first time, have true insights into your marketing investment and the returns for your business.
Want to take a quick tour?
Below is a quick overview of the features and benefits of both the Essentials and Premium (Plus & Pro) Tiers of the VitalMetrics Dashboard.
Essentials Free Dashboard Overview
Premium (Plus & Pro) Dashboard Overview
Core Dashboard Access
Centralized reporting dashboard built around your services
Visual performance views so data tells a story
Only shows what is relevant to your business
Intuitive charts, tables, and trend views
Easy navigation for insights
Leads-to-Revenue Insights Dashboard (Pro Tier)
A dual purpose lead dashboard that:
Acts as a simple CRM for managing leads
Tracks lead sources and statuses
Connects revenue back to marketing activities
Shows true return on marketing spend (ROMS)
This view allows you to understand performance from first contact to closed revenue.
Visual Reporting
Dynamic visualizations replace spreadsheets
Clear trend graphs for performance over time
Interactive dashboard experiences for deeper drilling
Benchmarking and period comparisons
Scheduled Monthly Reports
Each month, we deliver a professional performance summary that includes:
Visual trend insights
Narrative explanations
Highlights and opportunities
Prior-period context
Delivered directly to your inbox.
Key Capabilities
Easy-to-read dashboards
Data visualization with business context
Alerts on metric changes
Multi location grouping
Custom date range comparisons
Historical data accessible
Customization Options
We offer optional services to build:
Fully-custom dashboards
Executive-level reporting systems
Additional data source integration
Internal operational reporting views
These solutions are scoped and priced based on needs.
Business Value Summary
VitalMetrics provides:
Clear visual insights into marketing performance
Connection between spend and revenue outcomes
Tools to understand true return on investment
Simplified dashboards for fast understanding
Reporting that demonstrates value to stakeholders
Essentials
- Basic Reporting
- Automated Monthly Report
- Near Realtime Data Access
- Unlimited Users
- Cross-Channel Metrics
- Deeper Insight & Advanced Metrics
- AI Agent Insights & Summaries
- Custom Report Delivery
- Future Looking Actionable Insights
- Leads Dashboard (Simple CRM)
Plus
- Basic Reporting
- Automated Monthly Report
- Near Realtime Data Access
- Unlimited Users
- Cross-Channel Metrics
- Deeper Insight & Advanced Metrics
- AI Agent Insights & Summaries
- Custom Report Delivery
- Future Looking Actionable Insights
- Leads Dashboard (Simple CRM)
Professional
- Basic Reporting
- Automated Monthly Report
- Near Realtime Data Access
- Unlimited Users
- Cross-Channel Metrics
- Deeper Insight & Advanced Metrics
- AI Agent Insights & Summaries
- Custom Report Delivery
- Future Looking Actionable Insights
- Leads Dashboard (Simple CRM)